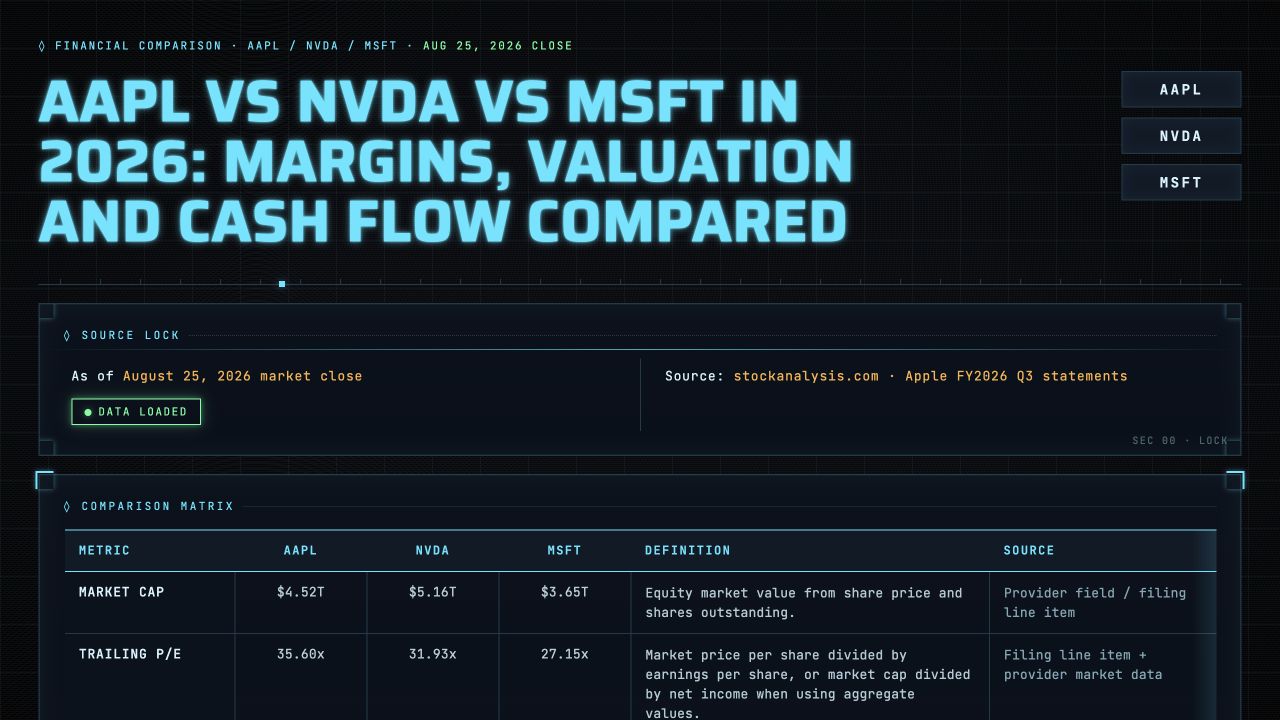
 Generated with Ancher · published 2026-08-25
Financial comparison
AAPL vs NVDA vs MSFT: margins, valuation and cash flow compared
Compare AAPL, NVDA, and MSFT across valuation, margins, return on equity, free cash flow yield, and the latest quarterly operating-margin trend.
The prompt
Comparable-metrics matrix prompt
A directly usable prompt preserved from the original X post.
Pull the latest financial metrics snapshot for AAPL, NVDA, and MSFT. Build a comparison table showing market cap, P/E ratio, EV/EBITDA, gross margin, operating margin, net margin, return on equity, and free cash flow yield. Then pull the last 4 quarters of income statements for whichever company has the lowest operating margin and show me the quarterly trend. Is the margin compressing or expanding?
Source trail
Original X post
The author, media, context, and direct source remain attached.
 @0interestrates2026-03-26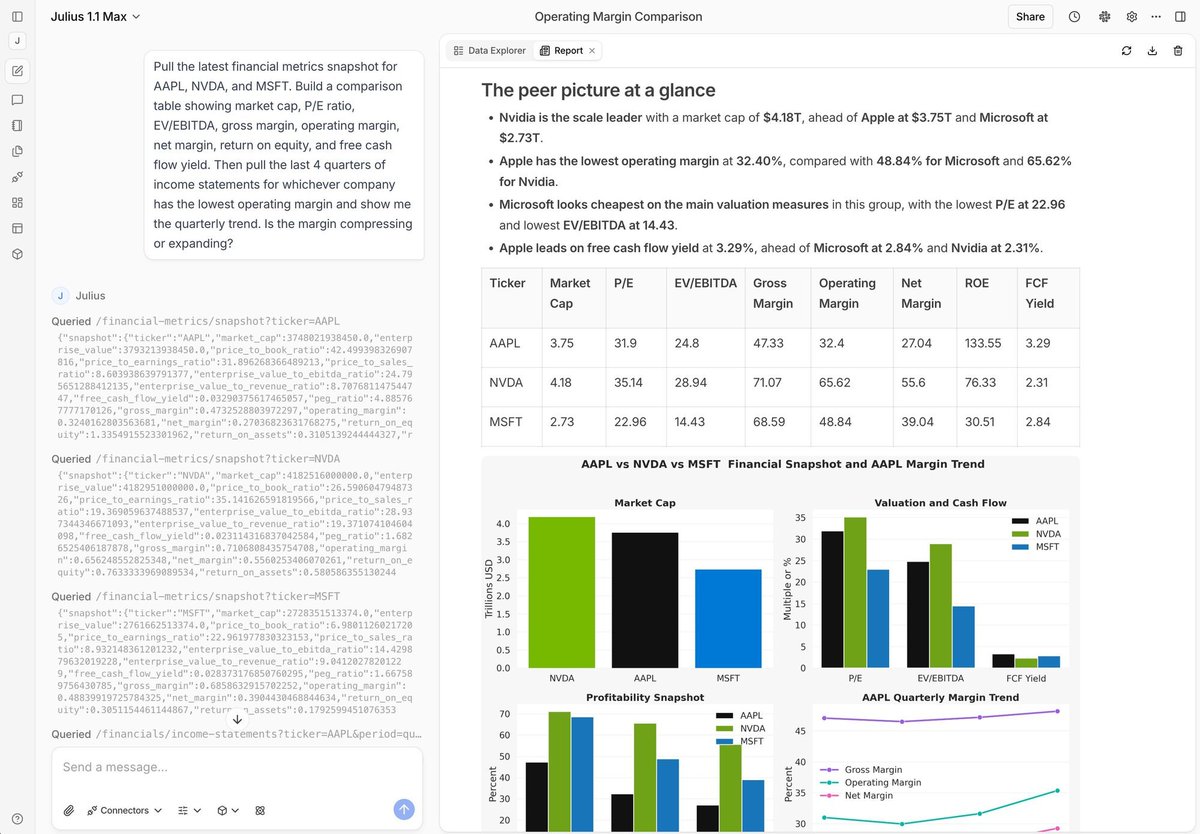
just one-shotted this. here's my prompt: Pull the latest financial metrics snapshot for AAPL, NVDA, and MSFT. Build a comparison table showing market cap, P/E ratio, EV/EBITDA, gross margin, operating margin, net margi…
See the original post →What you’ll get
- Comparison criteria
- Competitor set
- Evidence matrix
- Strengths and gaps
- Patterns
- Decision implications
What to provide
Bring the source material. Ancher shapes the deliverable.
Consistent product, pricing, audience, positioning, feature, and proof-point data for each competitor.